Preview: Camera Analytics & Intervention Loop
A concise walkthrough: what the camera sees, how models classify plant states, and how actions are scheduled and audited (without exposing proprietary implementation details).
In this section you will find high‑level summaries and insights extracted from our internal proposals and lightpapers. These documents capture our vision for intelligent cultivation, outline project phases, provide indicative budgets and highlight the economic benefits of adopting automation and AI.
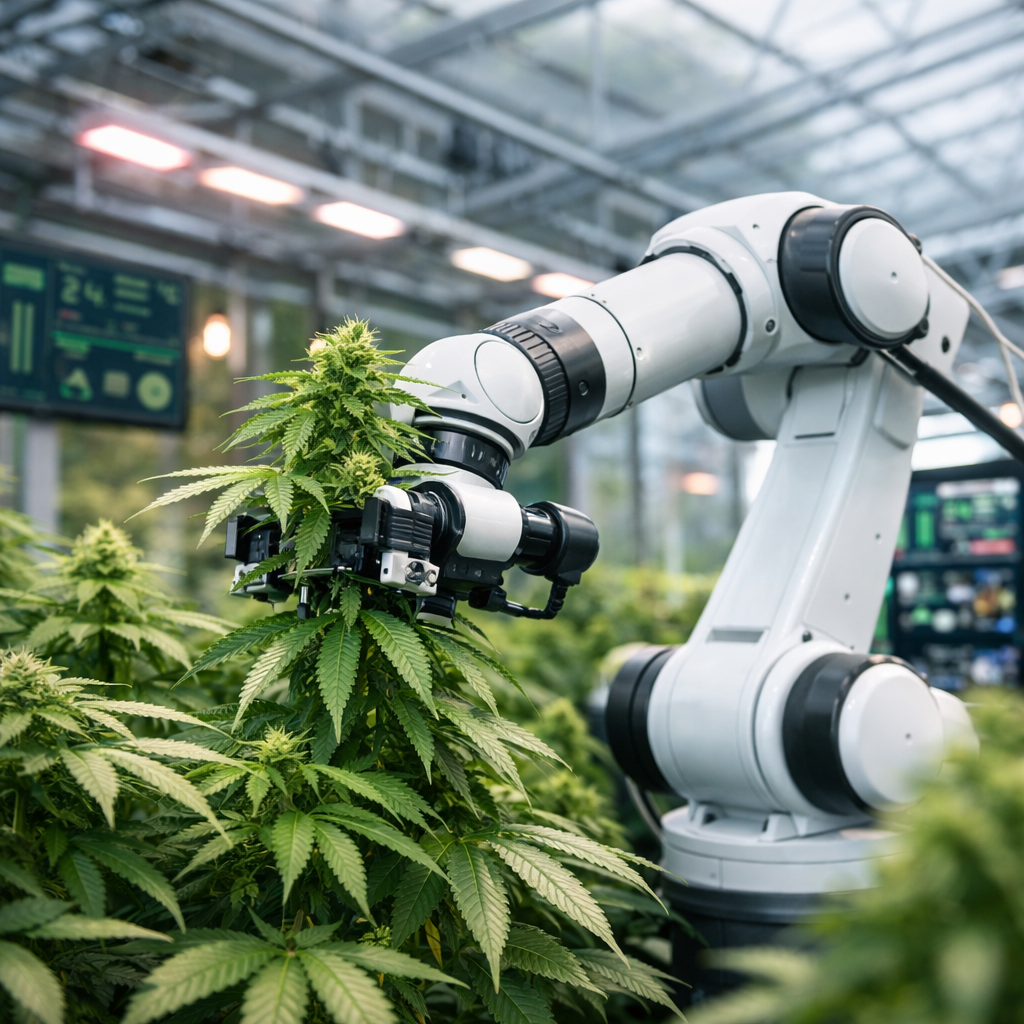
We can provide a short, client‑specific demo video showing the full workflow: camera analytics, event logging, task scheduling and robotic execution. For now, this section is a placeholder so we can swap in an embed link once the demo is approved.
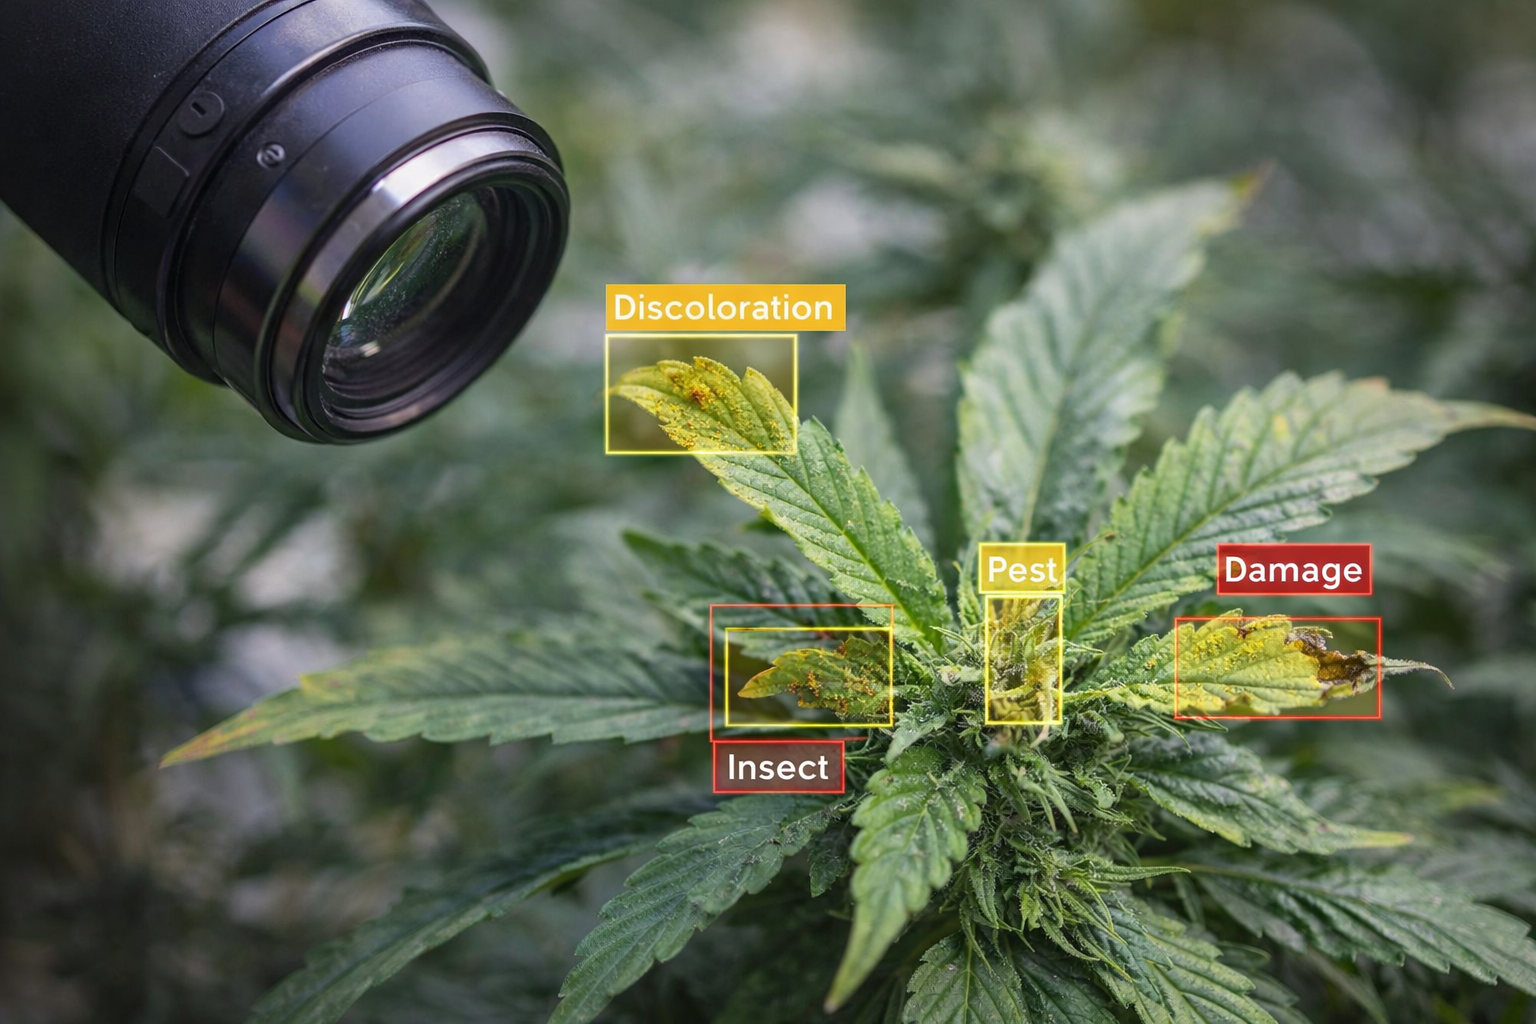
A concise walkthrough: what the camera sees, how models classify plant states, and how actions are scheduled and audited (without exposing proprietary implementation details).
Our Intelligent Cultivation Automation System (ICAS) transforms medicinal cannabis production into a real‑time, data‑driven process. Using computer vision, sensors, artificial intelligence and selective automation, every plant becomes a monitored entity. Continuous observation replaces periodic inspection, predictive intervention supplants reactive correction, and human oversight remains central.
The cannabis industry faces rising labour costs, limited manual scalability, inconsistent yields and late detection of plant stress. Regulatory pressures (GMP/CLP) demand traceability and auditability. ICAS addresses these challenges by reducing human dependence and enabling predictive control.
The system is modular and layered:
Our engagement model follows a phased approach:
Payment structures typically include a fixed fee for Phase 0, a monthly retainer during operations and a success fee tied to validated savings. The contract example indicates a closed price for Phase 0 (around €40k) and retainer of €4k/month, with a 10 % success fee on net savings.
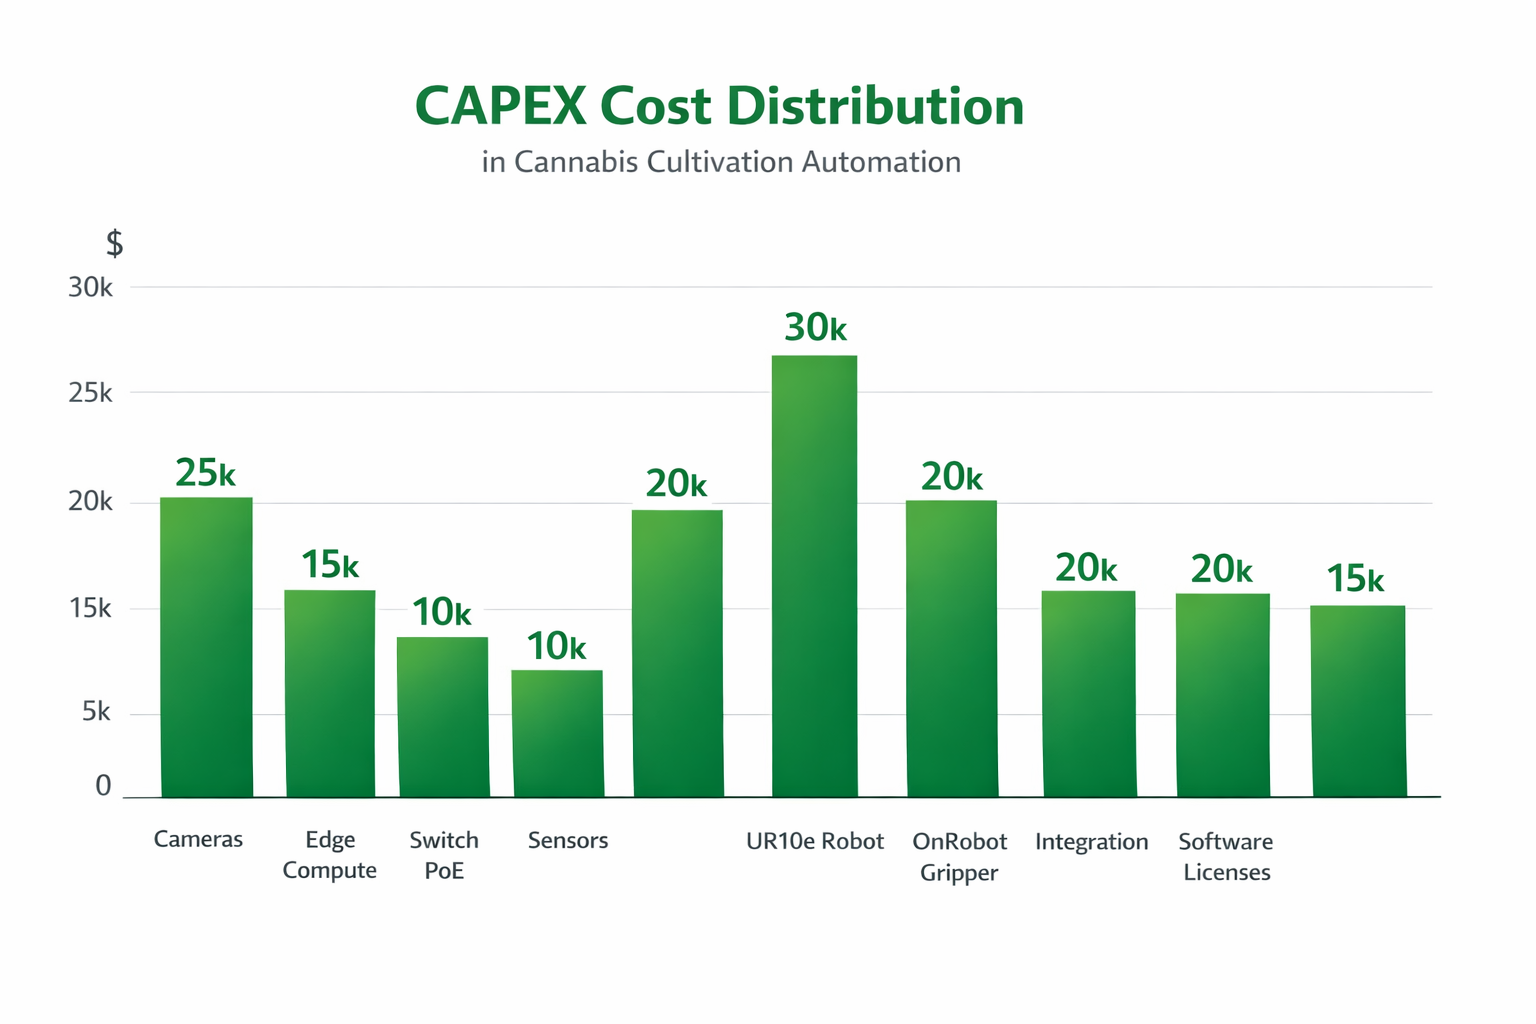
The following bar chart illustrates a representative breakdown of capital expenditure (CAPEX) across key categories in an automation project. Values are indicative and can be tailored based on facility size and technology selections.
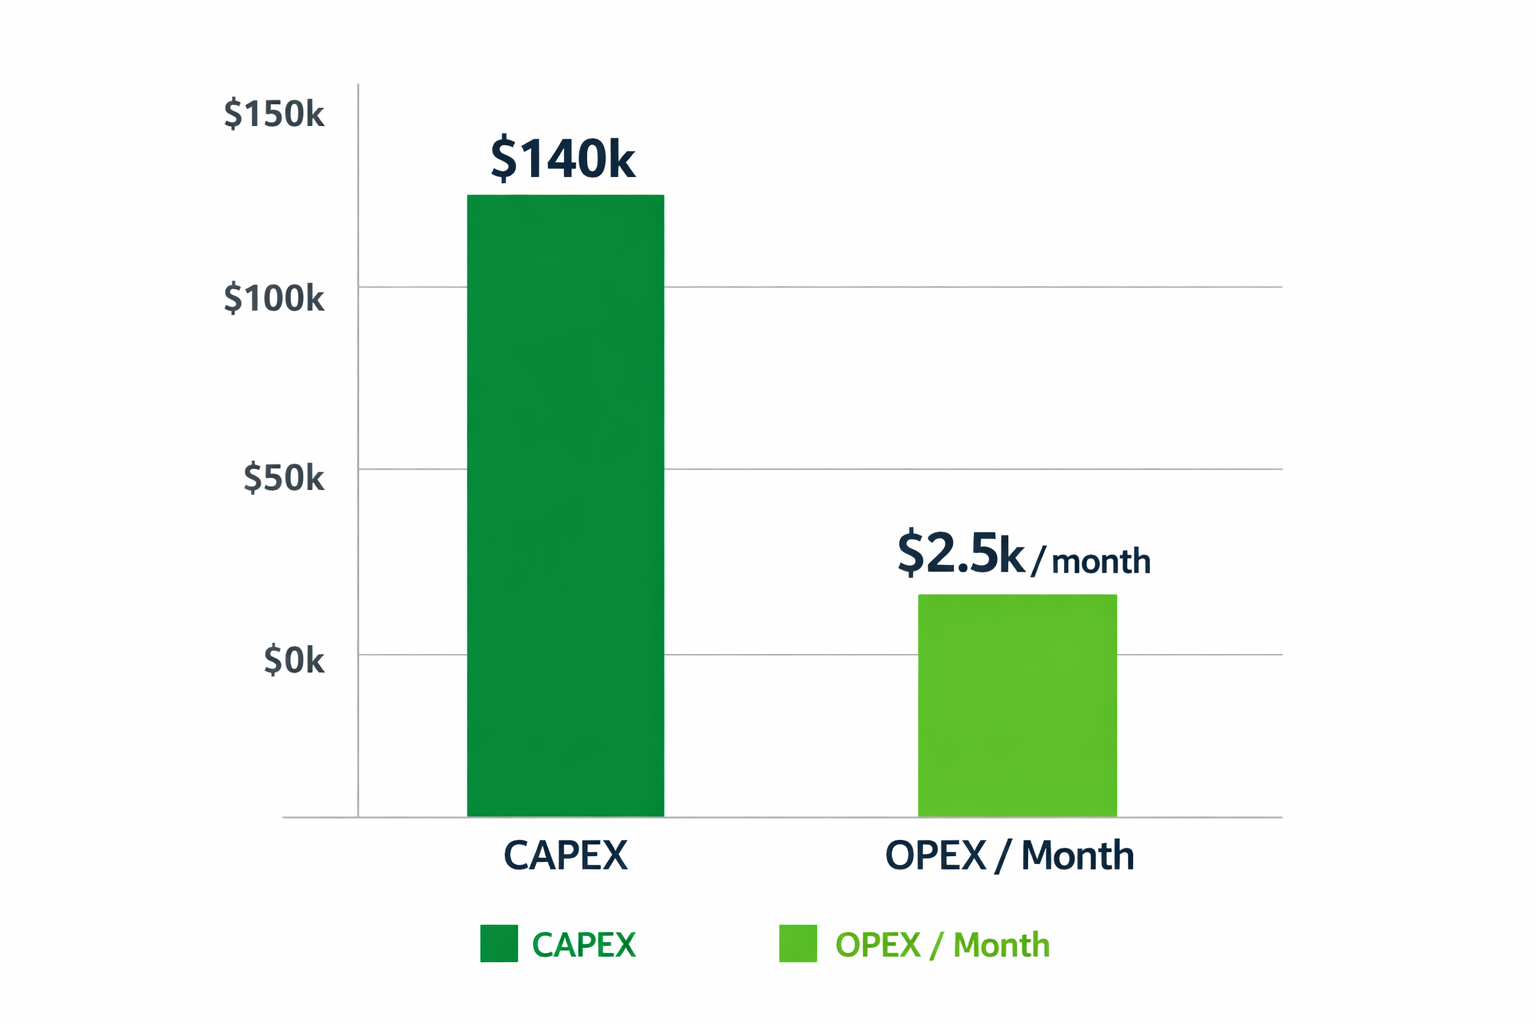
In addition, the comparison below highlights typical investment levels for CAPEX versus ongoing operational expenditure (OPEX).
Our experience shows that incremental deployment through phases leads to continuous improvement. The graph below illustrates how yields can rise and costs decrease as the system matures from concept to full intelligent operation.
For detailed proposals and commercial models, please contact us directly. We can tailor a solution for your facility and provide complete documentation under NDA.